Building a Stock Screening App
Introduction:
I’m building a stock screening app. I’m not a stock expert by any means; however, the strategies I’ve employed have been profitable at a small scale. I’m hoping to automate this since I don’t have that much time to pay attention to the daily happenings in the stock market. This app will be developed in two main phases and employ two principle strategies:
- Long Term Buy & Hold: Screen the stocks using the filters by getting quotes, growth percentages, and moving averages. Get a group of stocks with great potential and then track them on a daily basis until “buy indicators” are reached based on growth of moving averages. Trades are executed manually using my online brokerage accounts. Much like poker, stocks are dropped if there’s early signs that it won’t work out. Stocks continue to be tracked until sell points are reached. My goal with these stocks are to experience long-term growth and hold them at least a year so that I can sell them and owe less taxes.
- Automated Semi-Day Trading: This is using more of a Jesse Livermore approach. I read his stock trading book and while I’m sure he paid attention to the stock market every day, he makes it a point to say that he did not trade every day. Livermore’s strategy seemed to buy and sell in periods of several days. This automated program aims to make less than 10 trades a week as I don’t understand day trading well enough to do more than that. There is no paper trading with the TD Ameritrade API, so this will need quite a bit of testing before I let my program use real money.
The tech stack:
- Trading Platform: TD Ameritrade and its API
- Backend: Django REST Framework
- Database: MySQL
- Web Server: nginx on unmanaged VPS running Ubuntu, uWSGI for application interface
- Frontend: ReactJS
- Layout: Materialize
On the front end, I knew from the get-go I wanted to do this in ReactJS because I didn’t want to deal with page loads. I use a lightly-modified version of Materialize for the layout. I figure I’ll be looking at this a lot and it should look decent. While fairly complicated, there is not too much shared state values among the different parts of the app, so I decide not to use Redux. Routing is handled using the React Router.
For the backend, I want to keep daily track of the stock prices and manually calculate moving averages so I can customize the number of days in these averages. So, I decide to use Python and the Django REST Framework. The Django system of models and migrations will make designing the databases easier. Plus, doing the calculations in Python is always easier. The Django REST Framework easily converts Python dictionaries and lists into JSON, making delivery of data much easier.
For the database, I use MySQL because a relational database is a better choice for all the information it needs to keep. I don’t know that much about the difference between databases, I’m just used to this one.
Progress:
So, I start off by using CSV files from Nasdaq to list every stock available along with basic info. These are then filtered by Market, Industry, Age, Country, and Sector. My strategy revolves around growth and most growth happens with younger, smaller cap stocks instead of the blue chips. So, I normally filter out the big players. I do this after defining what small cap, mid cap, and large cap are. I also define what is young and old in terms of stock age. Next, I determine what growth criteria is needed to continue in the stock selection process. This is done in the Django admin backend.
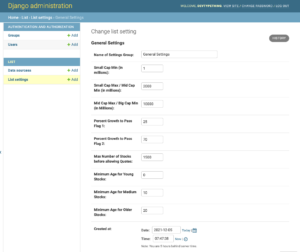
Here, I define the ranges for buckets like market cap and age. I also set criteria for stock growth thresholds.
For management purposes and to adhere to API rate limits, I don’t allow use of the API until the stock list is filtered to 1500 or less stocks. I avoid certain industries I don’t understand very well. So, those get filtered out before I continue with retrieving quotes. Individual stocks can be selected and removed.
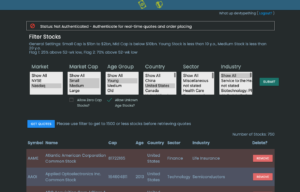
Once the filters are used and unwanted stocks deleted, you can use the API with the Get Quotes button
Once quotes are retrieved, growth vs the 52-week low is analyzed using a quick percentage calculation. In the aforementioned settings, I defined the thresholds in order to pass Flags 1 and 2. In this example, they’re set at 25% and 70%, respectively. You will also see the chart changes so that the stock basic information is summarized more succinctly in less columns and information like the growth percentage, current stock price, the stock’s pass status vs the flags become available.
Also, buttons become available now to get the moving averages and to automatically narrow down the list by dropping stocks that have failed to pass the Flag 1 and / or Flag 2 growth thresholds.
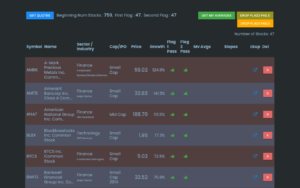
Here, the stock list now only has stocks that have risen at least 70% from their 52-wk low
The next part of the app is to get the moving averages. It’s important to narrow down the list since getting the moving averages requires using a price history API that is rate-limited to only 120 requests per second. Even though the app can handle more by waiting between API requests, I simply don’t send stocks to this phase unnecessarily.
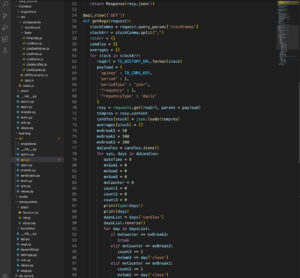
There’s a certain beauty to Python code. No brackets, forced cleanliness. Makes me happy.
When the list is narrowed down enough, the list can be captured and is sent as a POST object to the Django REST Framework where a model was previously set up to send the list to the database. From there, a cron task updates the moving averages and measures the rate of moving average growth to find buy indicators.
The rest is kind of like secret sauce so I don’t want to get into it too much. However, phase 1 of the program is complete and I’m actively working on getting phase 2 up and running. The funny thing is that this app can work perfectly but still not make any money. Actually, that’s not that funny….